

Overview
At the time of publishing, Bitcoin has fallen a gut-wrenching ~50% from its high near $126k to around $60k.
For long-time holders, this isn’t unusual. Previous Bitcoin bull cycles have included drawdowns of 30–50%, though full bear markets have produced declines closer to 80%.
This raises the obvious question: Is this the start of a prolonged bear market, or a shorter drawdown within an ongoing bull market?
This article explores the current Bitcoin drawdown through a framework combining on-chain data, retail and institutional ownership, technical analysis, and human behaviour.
1. Ownership
Ownership data can help show how widely an asset is held, and from this we can infer how much room remains for allocations to grow depending on other fundamentals.
Retail ownership is broad, but typical positions remain modest
Bitcoin has established a meaningful foothold among retail investors, but it still lags some other asset classes considerably.
About 14% of adults report owning Bitcoin or other cryptocurrencies, compared with roughly 60% of Americans who own stocks and a similar share who own their home.
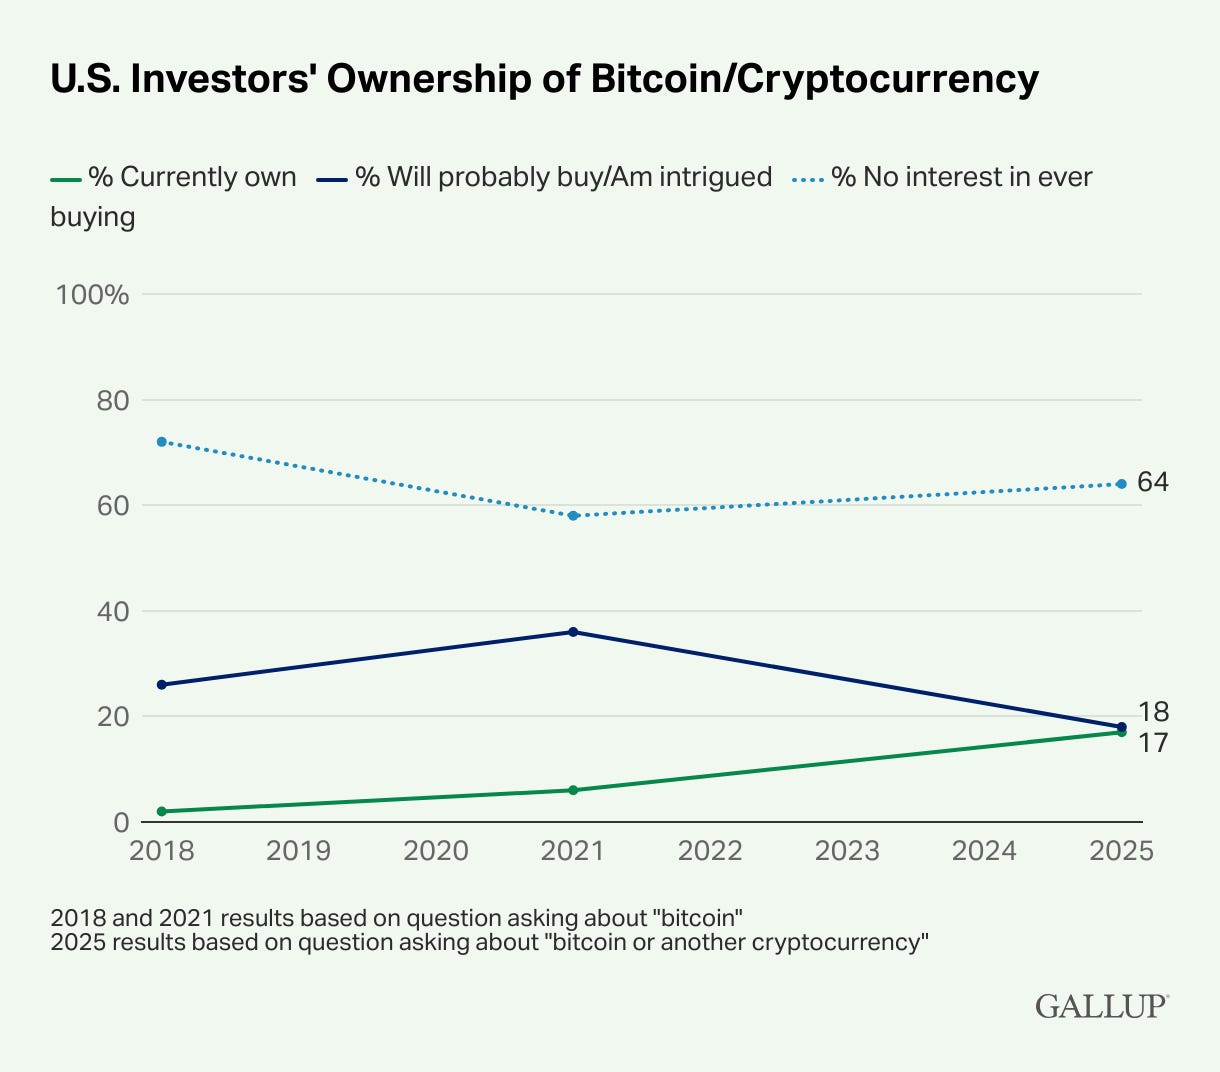
Position sizes in crypto remain relatively modest: a 2025 Harris Poll survey of 10,000 US crypto holders found that more than half held less than $10,000 worth.
Globally, Crypto.com estimates that cryptocurrency ownership reached 741 million people by the end of 2025, including approximately 365 million Bitcoin owners.
These are modelled estimates rather than directly observed counts, but they reinforce a picture of broadening participation with room for individual allocations to grow when compared with other asset classes like stocks.
Whales appear to be accumulating into weakness
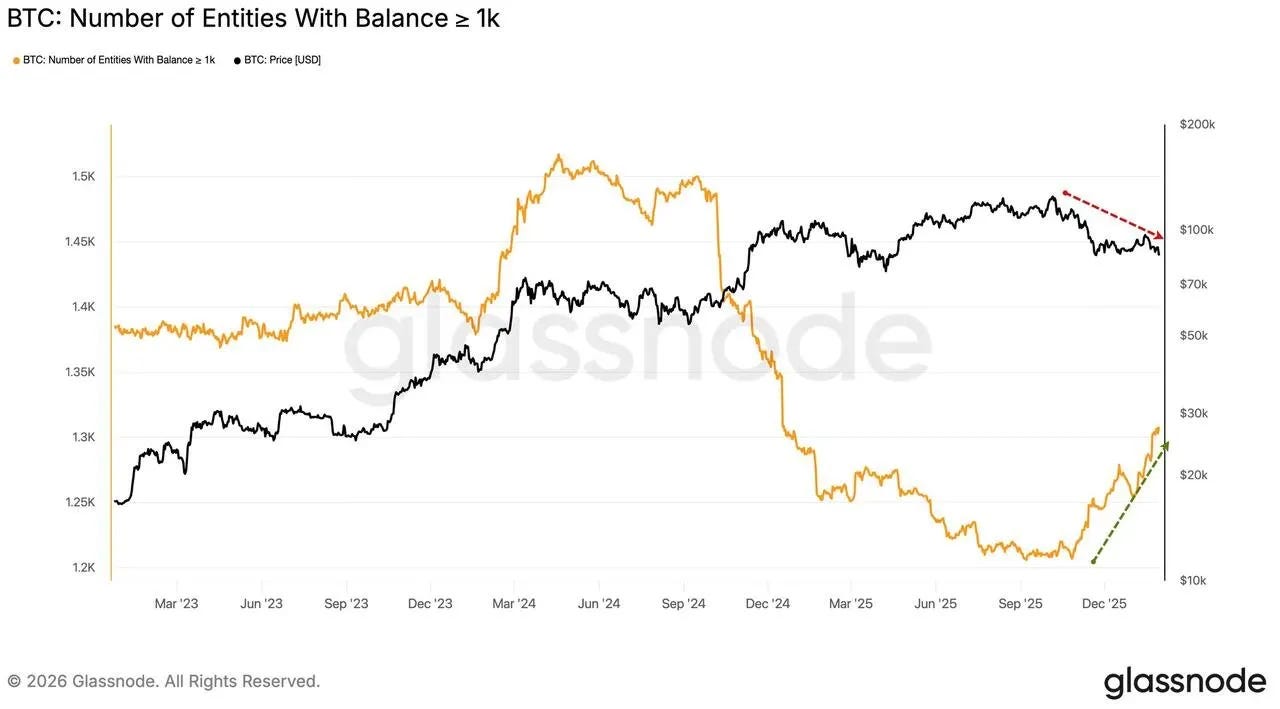
Glassnode data show that the number of entities holding at least 1,000 BTC has increased since late 2025, even as Bitcoin’s price has declined.
This is consistent with accumulation by larger holders, although Bitcoin’s pseudonymous nature means wallet-level data cannot reliably distinguish individual investors from entities such as custodians and exchanges.
Institutional exposure remains limited
Institutional allocation remains relatively low. 84% of surveyed fund managers said they had not begun structurally allocating to crypto, but the conversation is shifting from whether crypto belongs in a portfolio to how large an allocation may be appropriate.
In December 2025, Reuters reported that Bank of America would allow advisers across Merrill, Bank of America Private Bank and Merrill Edge to recommend selected crypto exchange-traded products. Its guidance suggested that an allocation of 1% to 4% could be appropriate for investors comfortable with elevated volatility.
Crypto is becoming less of a “yes-or-no” question. It’s increasingly a portfolio sizing question.
2. Technical Analysis
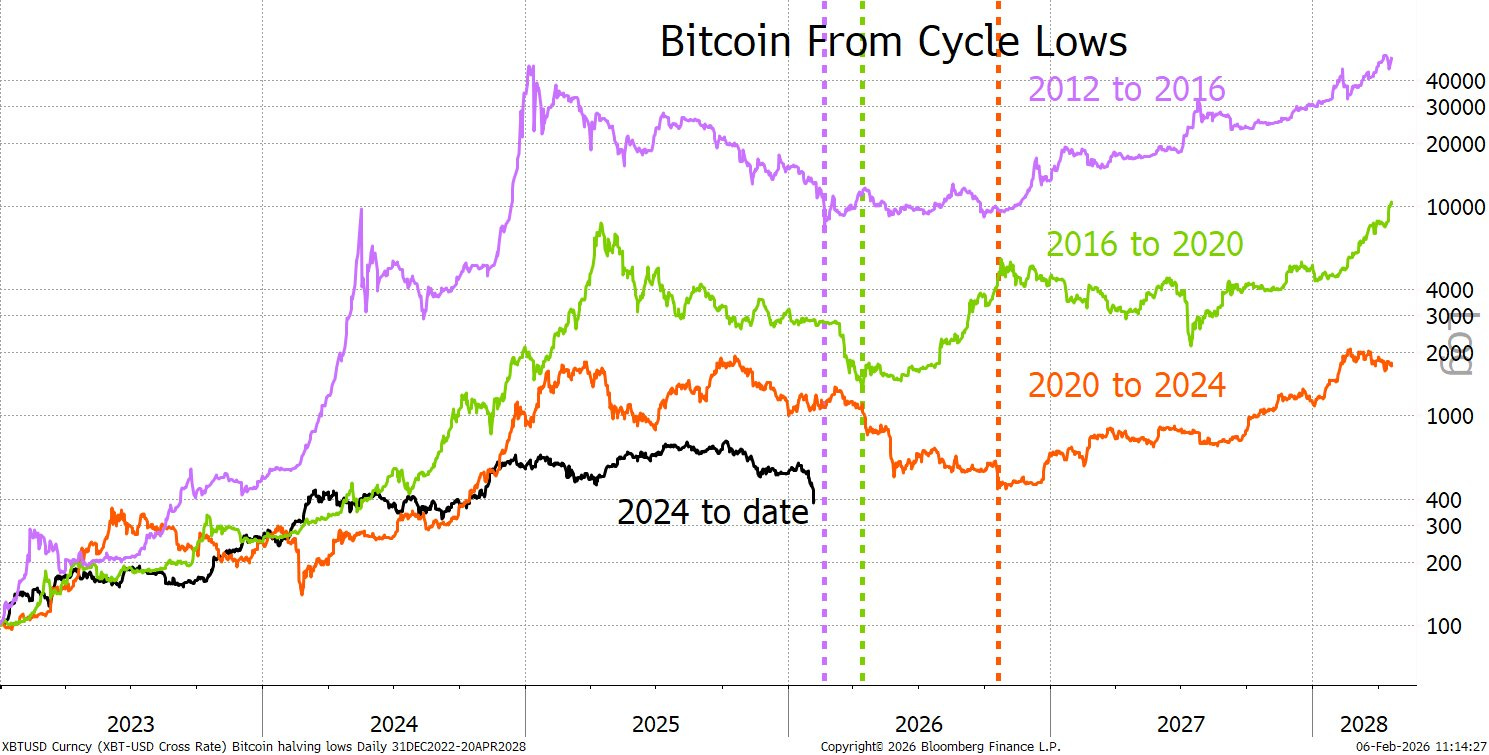
Price is now entering a zone where prior cycle lows have often formed:
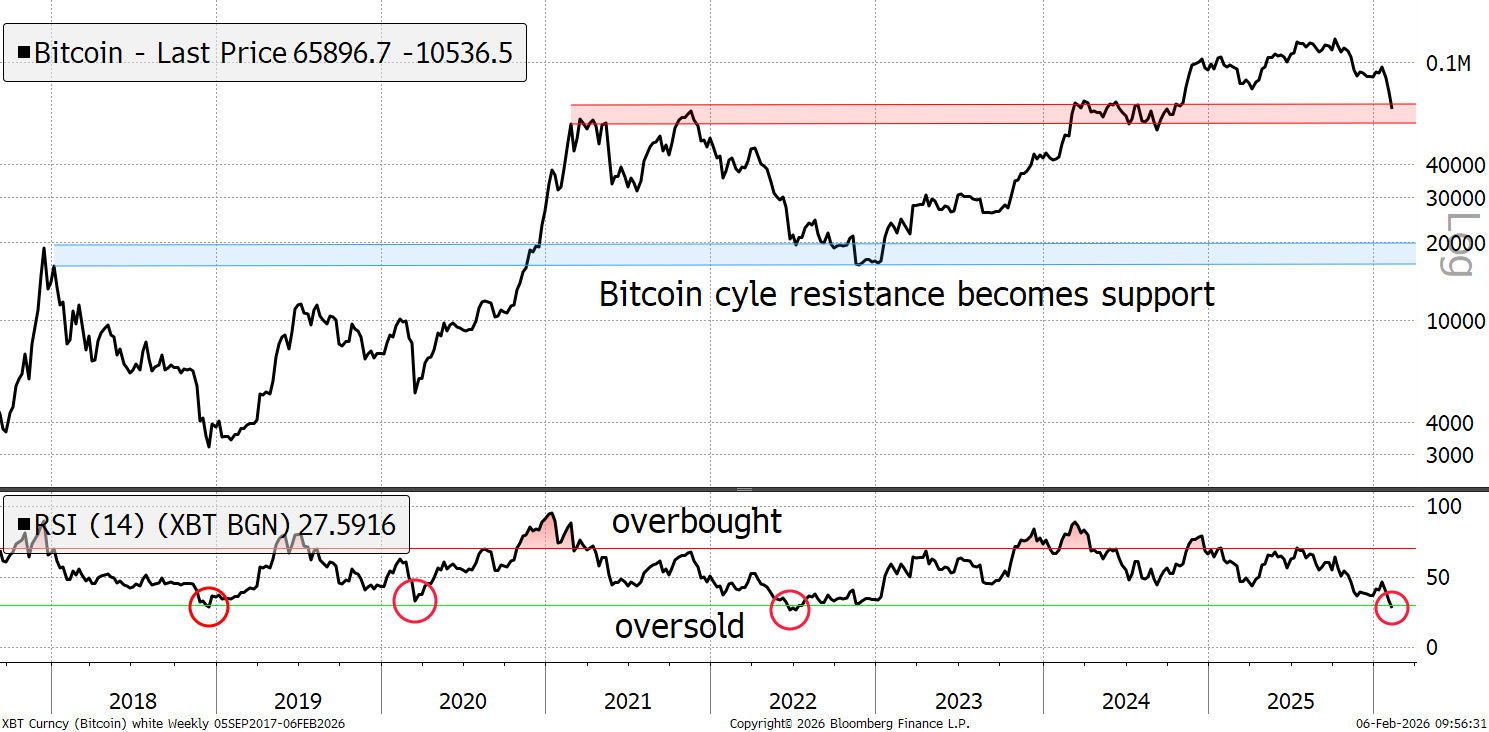
Momentum tells a similar story. RSI has fallen to levels that have previously coincided with market bottoms or bottoming ranges:
3. Sentiment
Negative sentiment is a late-stage signal
When everyone loves an asset, that is often seen through elevated asset prices. Conversely, when sentiment is overwhelmingly negative this often coincides with depressed asset prices.
Extreme negative sentiment can create a more attractive entry point when the underlying investment case remains intact, although it does not guarantee that the decline is over.
How to measure sentiment with Bitcoin?
Headline sentiment on the widely known CoinMarketCap Fear & Greed Index is deeply negative. At the time of writing, the index has returned to 5, which is defined as extreme fear.
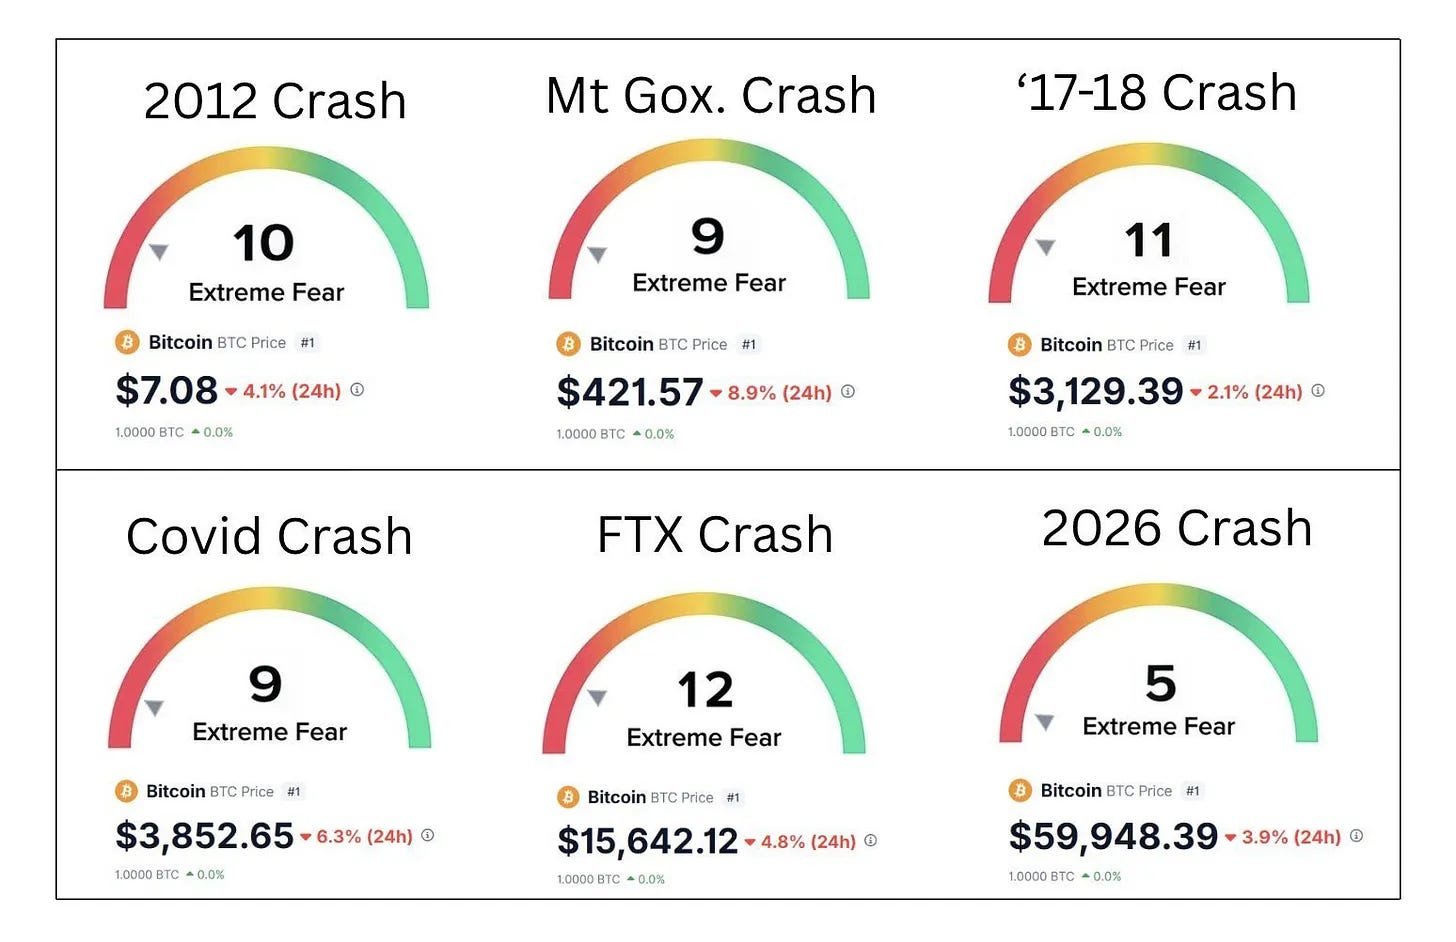
I’m a bit skeptical about CoinMarketCap’s method of measuring sentiment, but it can be a good gut check for the wider industry. Generally, I find qualitative methods better for getting a read on sentiment.
Mainstream media tone tends to reflect broad public sentiment quite well
Near major tops or bottoms, media coverage tends to mirror the market’s optimism or pessimism, ironically reinforcing the prevailing sentiment.
A good example is this NYT article, published just a few weeks before the peak of the 2017/2018 crypto bull market.

At the other extreme, the ECB’s Ulrich Bindseil and Jürgen Schaaf published “Bitcoin’s Last Stand” just as Bitcoin reached its cycle low near $15,500. The article argued that Bitcoin would become largely irrelevant. Bitcoin subsequently rose by more than 600% to approximately $126,000.
Elsewhere, coverage remains cautious of Bitcoin. A recent BBC article cited forecasts as low as $38,000, which would represent another decline of approximately 37% despite Bitcoin already being down roughly 50%.
Extreme forecasts appearing after an asset has already moved precipitously can therefore be useful as a contrarian sentiment indicator, particularly when they reflect narratives that have become widespread beyond the asset’s existing investor base.
Social media discussion
Comment sections on news articles, forums and social media are an underrated sentiment indicator.
When an asset price is extended, discussion tends to be curious, exploratory or optimistic. Conversely, when prices are depressed, sentiment tends to become dismissive, hostile or pessimistic.
In mainstream investing communities like r/investing, the dominant view is that Bitcoin has no fundamentals at all: no earnings, no balance sheet.
The recurring phrases are remarkably consistent: “greater fool asset,” “pure speculation,” “no intrinsic value,” “just a number in a database,” plus comparisons to tulips or Beanie Babies.
Strong opinions without ownership
One useful sentiment indicator is the perspective of people who have little or no exposure to Bitcoin but hold strong views about it. This group can provide insight into the narratives influencing the wider public.
Conclusions should not be drawn from isolated conversations. Instead, I look for recurring themes across multiple discussions, using neutral questions to understand what is driving people’s views.
In my own conversations, I am noticing a move towards skepticism, with discussion clustering around a small set of themes:
Bitcoin’s political association with Trump, often viewed negatively
Energy “waste” narratives
Claims of a lack of real-world use cases
I would like to see this skepticism move closer to outright disdain before being more confident taking a larger position. I am more comfortable adding to my BTC holdings when public sentiment is heavily negative and yet fundamentals remain intact. This is because negativity creates room for repricing as disbelief gradually converts into allocation, assuming ownership and structural conditions support that shift. That is what we will examine next.
So, is the bottom in?
Bitcoin has seen 30–50% drawdowns within bull markets, while full bear markets have typically involved 70–80% peak-to-trough declines.
From the $126,000 high, a 70% decline would take Bitcoin to roughly $38,000, while an 80% decline would imply a price closer to $25,000.
Both remain possible. But based on a confluence of indicators, I think the balance of probabilities increasingly favours the current decline being close to its end:
Retail penetration is growing, but typical positions remain modest compared with other asset classes, leaving room for allocations to grow if the underlying investment case persists.
Institutional penetration and allocations remain low, leaving another potential source of future demand.
Larger holders appear to be buying into weakness rather than selling.
Price and momentum are now at levels associated with previous Bitcoin bottoms and bottoming ranges.
Sentiment has shifted from optimism towards pessimism across a range of quantitative and qualitative measures.
Taken together, I’m a buyer at $60,000. None of these indicators can identify the precise bottom, but collectively they make me comfortable accumulating at current levels, and in greater size if prices fall further.